Confocal Raman microscopy
Raman spectroscopy is based on the Raman scattering effect, which enables to study vibrational motions in molecules. This technique is complementary to infrared spectroscopy (IR), because samples with high Raman activity tend to be less active in the IR spectrum and vice versa. Raman spectroscopy does not detect CO2, water or glass, which is an advantage over IR spectroscopy.
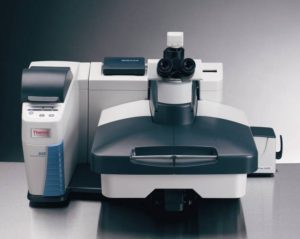
Figure 1: DXR Raman microscope 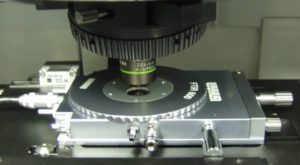
Figure 2: High-pressure cell
Confocal Raman microscopy enables the measurement of Raman spectra with high spatial resolution, providing an effective tool for the characterization of heterogeneous materials. The method is based on the focusing of the excitation laser on a very small spot, from which the Raman signal is then collected. The chemical composition of features such as small domains, micro-particles or heterogeneities can thus be studied.
Our device is a DXR Raman microscope from Thermo-Fischer Scientific. The most important parameters of the device are:
- lateral resolution (xy) up to 1 µm and depth resolution up to 2 µm
- spectral range from below 100 to 3600 cm-1 with a spectral resolution up to 2 cm-1
- three excitation lasers (532, 633 and 780 nm) and various lenses for high flexibility
- fiber optics, high-temperature pressure cell and extended lens holders enabling the measurement of Raman spectra in demanding applications
- fully automated acquisition of 2D or 3D spectral maps (chemical maps)

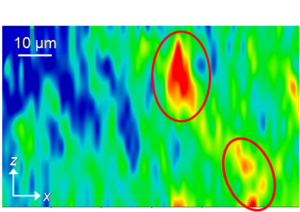
Figure 3: Chemical maps of two PE samples. Red color denotes zones with lower density.
Raman spectroscopy is a very powerful technique for the characterization of polymers and inorganic species, because (i) vibrations in the carbon backbone of polymer chains are highly Raman active and (ii) inorganic species tend to have vibrations at low wavenumbers, which are often below the lower wavenumber limit of IR spectrometers.

Figure 4: Supercapacitor electrodes based on manganese oxides after different numbers of charge-discharge cycles. The red spectrum is a non-cycled electrode and can be identified as Mn3O4, the blue spectrum is an electrode after 500 cycles and can be identified as MnO2, and the green spectrum is an electrode after 250 cycles, where both oxides are present.